Approach
- Problem formulation - what is the story?
- What data to use; are data available?
- Cleaning and organising data
- Select proper visualization technique (interactive?)
- Structured and analytic
Technologies and Tools
- Python and Bokeh visualization
- Javascript Threejs
- WebXR (Javascript) or Unity for Virtual Reality
- A bit of Power BI
- Data retrival from web api or any custom file formats
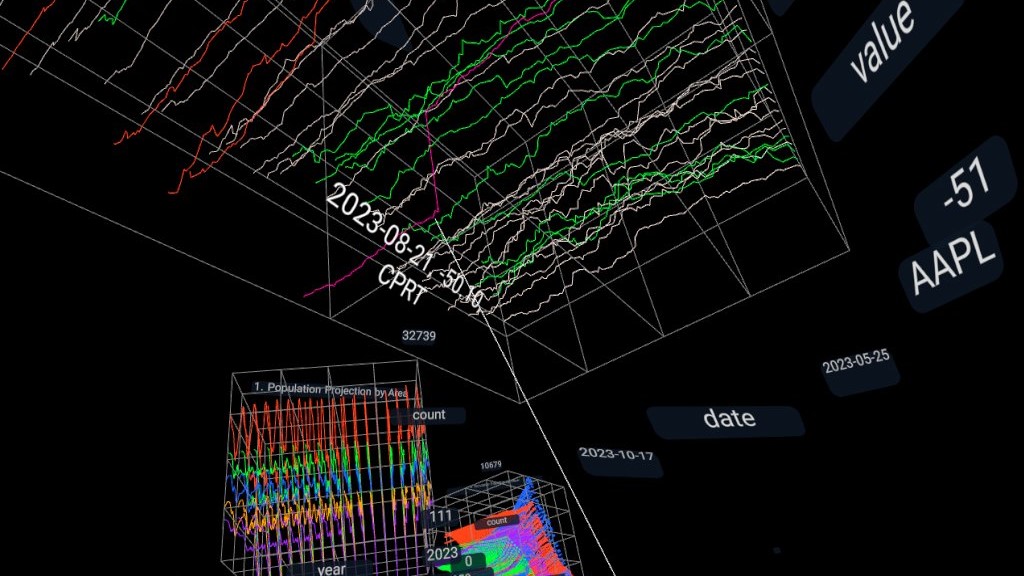
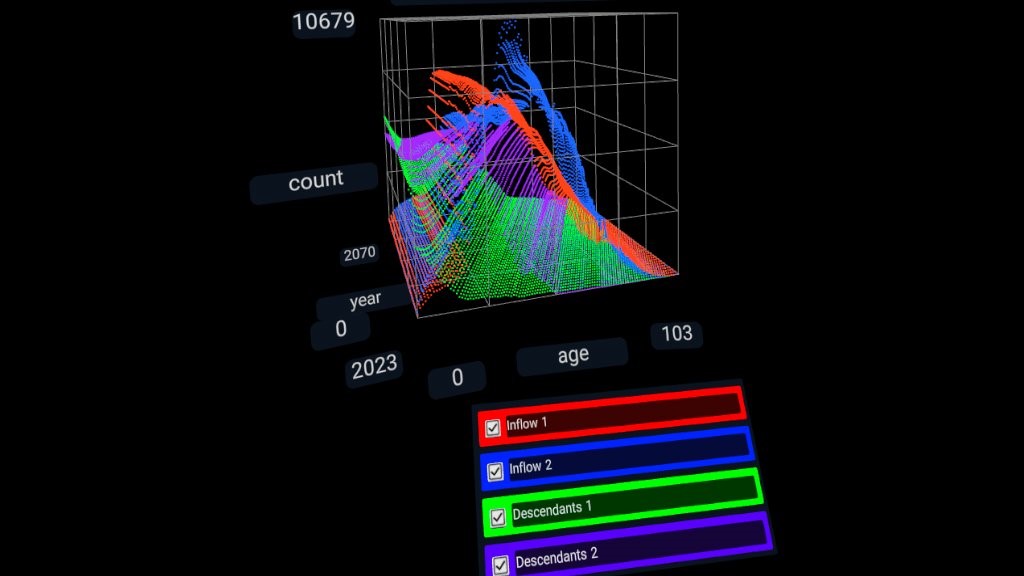
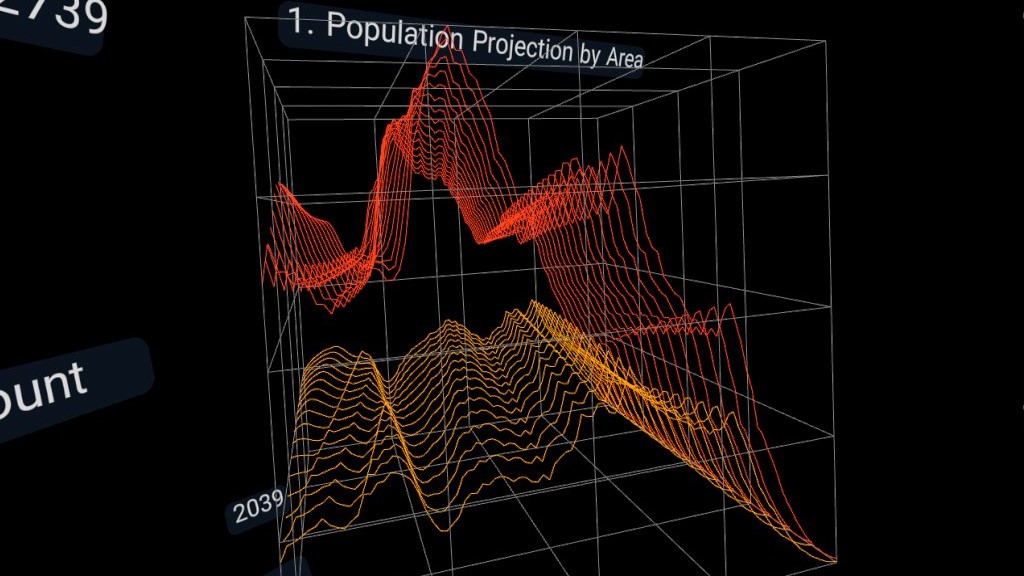
Welcome to data visualization solutions that encompass both Virtual Reality (VR) and non-VR platforms. As a freelance professional with a Ph.D. in Man-Machine Interface, I specialize in exploring and presenting large data sets through immersive VR experiences, as well as leveraging “normal” non-VR data visualizations.
Data visualization plays a critical role in uncovering valuable insights within complex data. With my expertise, I offer a comprehensive range of options to suit your specific needs and preferences allowing you to peer through the statistical fog and uncover new evidence.
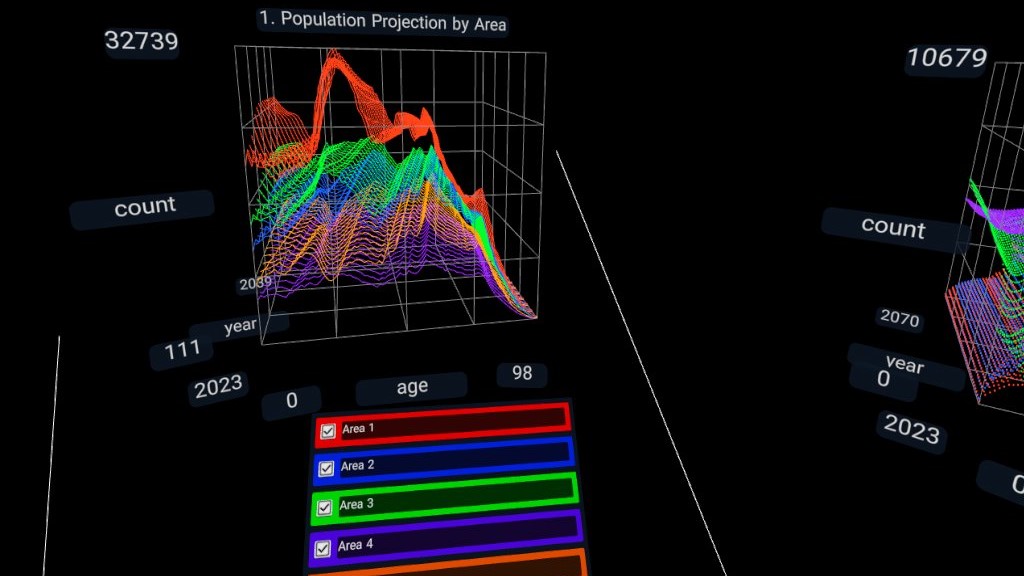
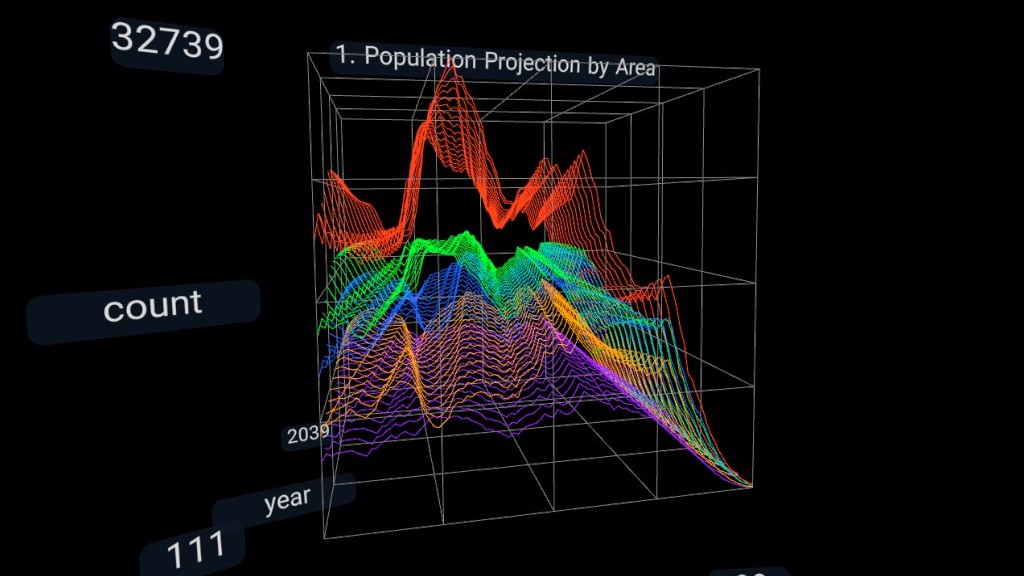
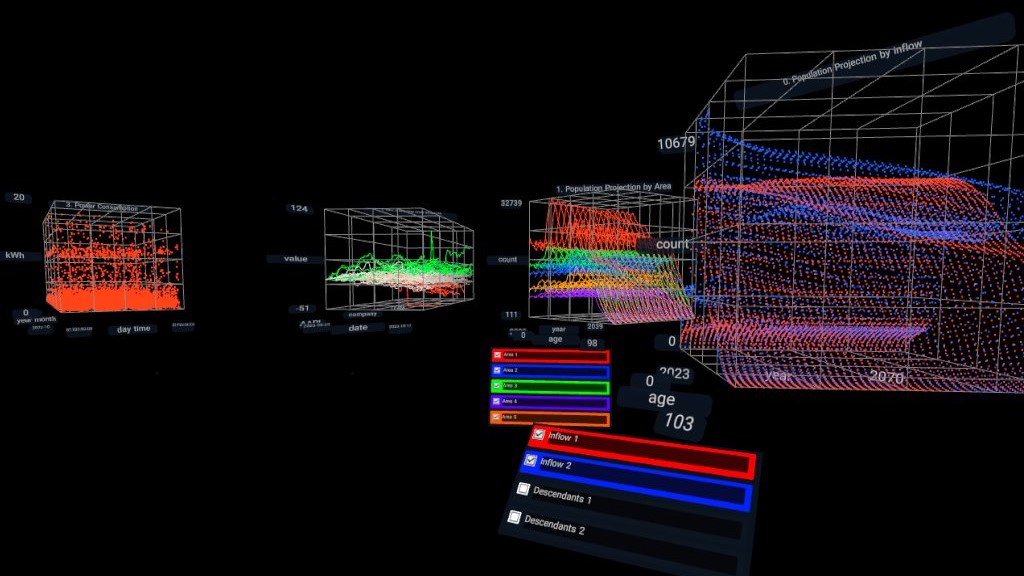
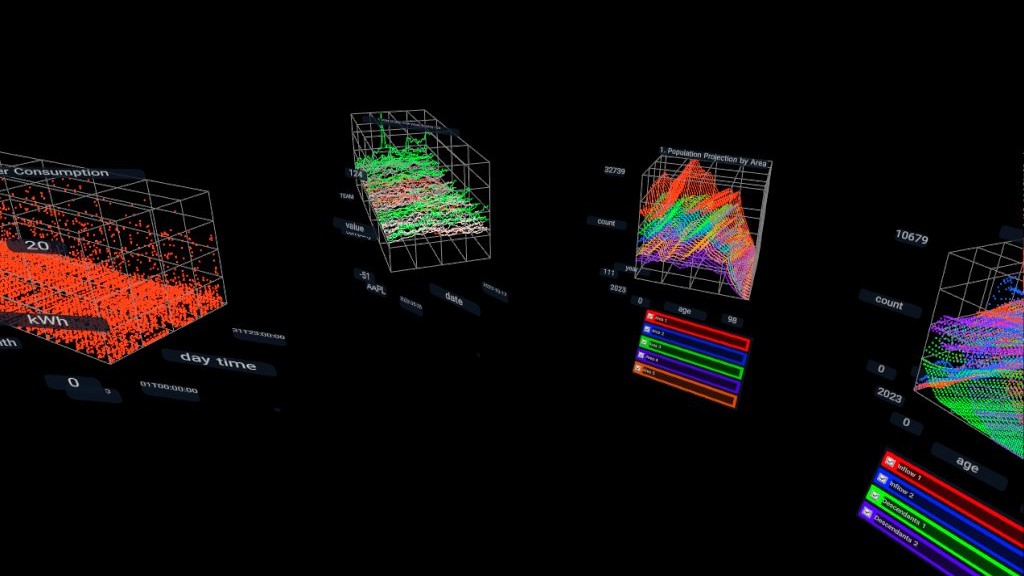
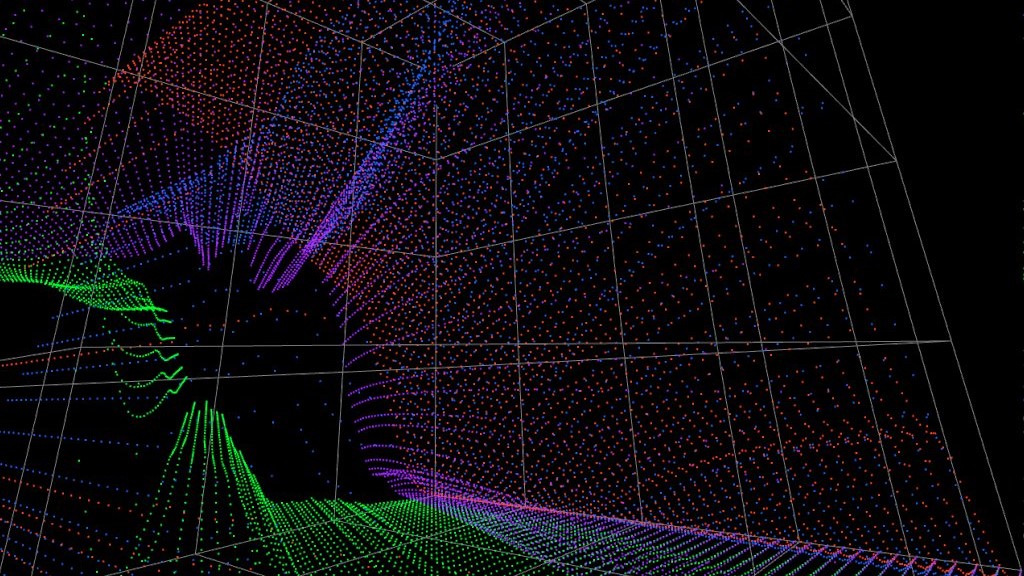
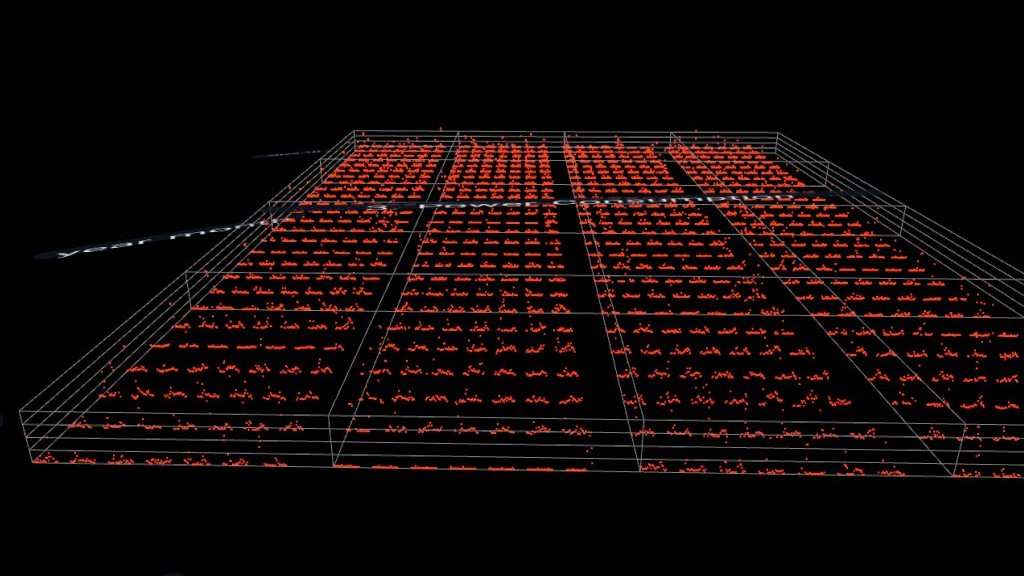
For those seeking VR experiences, see Virtual Reality Data Explorer for intuitive and immersive interfaces that allow users to navigate and interact with data in a three-dimensional virtual environment. By leveraging VR technology, we can enhance data exploration and analysis, facilitating a deeper understanding of complex information.
Alternatively, I also provide non-VR data visualization solutions; often using Python’s powerful Bokeh library or occasionally Microsoft Power BI. These platforms offer versatile and interactive visualization tools that allow for in-depth analysis and dynamic reporting. With such tools we can create interactive dashboards, insightful charts, and visually compelling presentations to effectively communicate your data-driven insights.
By leveraging both VR and non-VR visualization techniques, I ensure that your data is presented in the most effective and engaging manner possible. Whether you require immersive VR experiences, interactive web-based visualizations, or dynamic dashboards, I deliver customized solutions tailored to your specific requirements.
Contact me today to discuss your data visualization needs. Have you ever thought of “flying” through your data to get new insights? Together, we will determine the best approach, whether it be through VR or not, to effectively convey your data-driven insights and drive meaningful results.
Additional Information
Ph.D. Thesis: A Systematic Approach to Design of Process Displays (1999)
